
The first edition of Critical Reviews in Psychiatry (Reference Brown and WilkinsonBrown & Wilkinson, 1998), one aim of which is to instill principles of evidence-based medicine in psychiatric trainees, had the following question and answer:
‘Q: If a 95% confidence interval of an odds ratio contains the number 1.0, what does this mean?
A: It means that the odds ratio is not significant’ (p. 177).
Many psychiatrists would consider that there is little basis for applying to clinical practice findings that are not significant. Doing so might even be dangerous.
In response to the controversy about fluoxetine and suicidality in the early 1990s, Eli Lilly and Company analysed their clinical trials for suicidal acts (Reference Beasley, Dornseif and BosomworthBeasley et al, 1991). The analysis gave the relative risk of suicidal acts for patients taking fluoxetine compared with placebo as 1.9 (95% CI 0.2–16.0). This led Beasley et al to state ‘Analysis of the incidence of suicidal acts (suicidal attempts and completions) revealed no statistically significant differences in the act rates between fluoxetine-treated and placebo-treated patients’. And the conclusion they drew from this lack of significance was that ‘Data from these trials do not show that fluoxetine is associated with an increased risk of suicidal acts or emergence of substantial suicidal thoughts among depressed patients’ (Reference Beasley, Dornseif and BosomworthBeasley et al, 1991).
The problem in this thinking can be brought out by considering where confidence intervals (CIs) come from. Figure 1 shows a P-value function, which gives the point estimate for a relative risk and a distribution of potential values around this point (Reference PoolePoole, 1987). The P-value is the point at which the distribution of values intersects with the vertical axis running through x = 1. This graphical representation makes clear that, although a 95% CI may be a desirable threshold, at values less than this the overwhelming bulk of the data may well fall clearly on one side or the other of 1.0, which is the value for no effect.
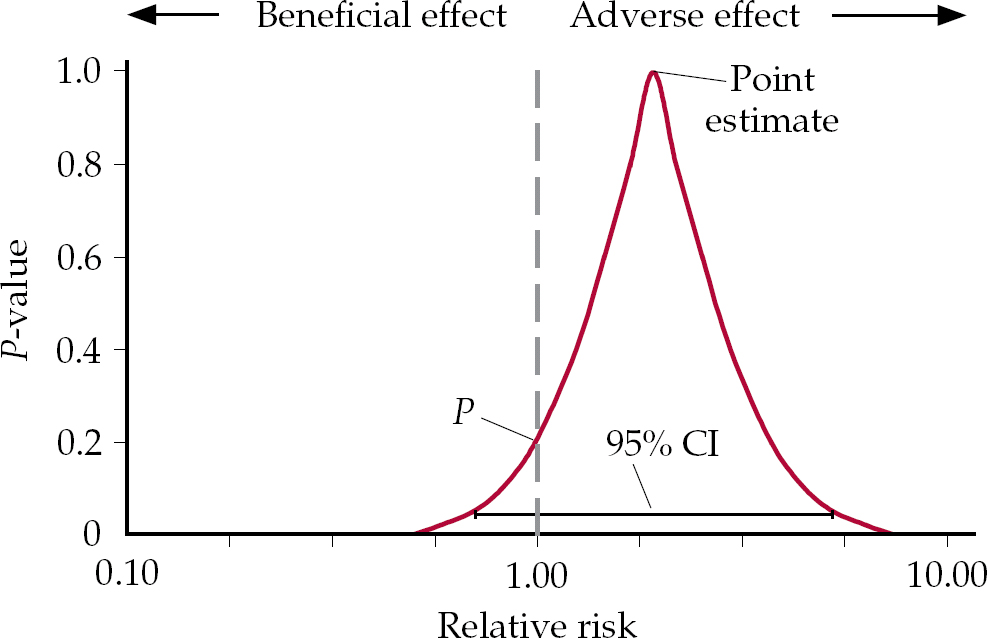
Fig. 1 A P-value function showing the distribution of all confidence intervals.
If the point estimate falls to the right or left of 1.0, but is not statistically significant, we enter a domain in which it is not true that there is no effect, but the conventional wisdom is that if this effect is not significant, there is in fact no effect. These competing interpretations can be tested with the hypothetical example of drugs A and B in Fig. 2. Drug A has a relative risk for death of 2.0 and this is significant (P=0.04). In contrast the relative risk of death for drug B is 8.0, but P=0.09, which is not significant. Which drug would you be safer taking? Drug A is clearly safer than drug B. Whether the P is significant or not does not alter the magnitude of the risk, which is much greater in the case of drug B.
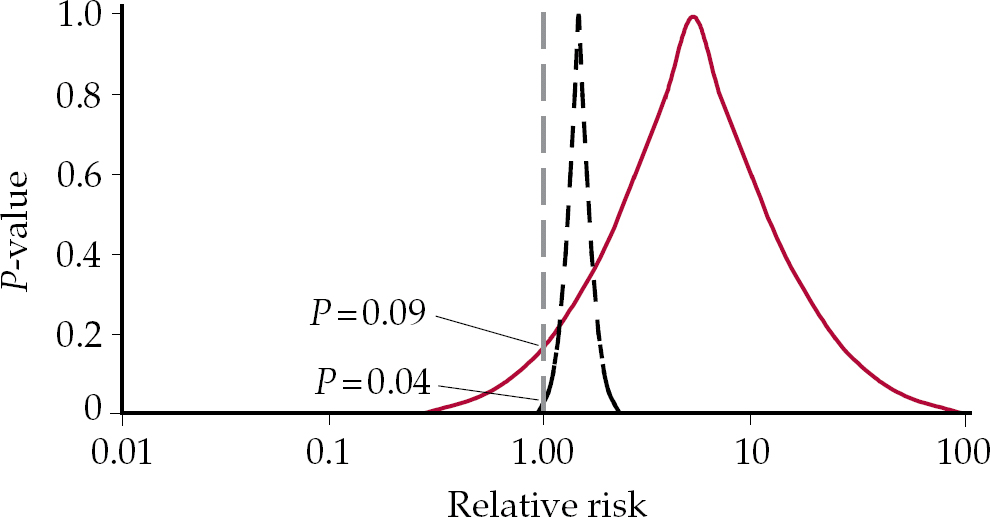
Fig. 2 P-value functions for drugs A (dashed black curve) and B (solid red curve) with differing relative risks and differing levels of significance.
These issues of interpretation are not confined to adverse effects or to psychiatry. For instance, reviewing a paper on treatment with heparin (Reference Hommes, Bura and MazzolaiHommes et al, 1992), Reference Messori, Scrocarro and MartiniMessori et al(1993) state:
‘The recent paper by Hommes and colleagues reports a meta-analysis of six randomised trials comparing subcutaneous heparin with continuous intravenous heparin for the initial treatment of deep vein thrombosis… The result of our calculation was an odds ratio of 0.61 (95% CI 0.298 to 1.251; P > 0.05); this figure differs greatly from the value reported by Hommes and associates (odds ratio, 0.62; 95% CI, 0.39 to 0.98; P < 0.05)… Based on our recalculation of the overall odds ratio we concluded that subcutaneous heparin is not more effective than intravenous heparin, exactly the opposite to that of Hommes and colleagues’.
Graphical representation of the two datasets (Fig. 3) reveals the problem in the Messori et al interpretation that the written version may conceal. It simply is not right that both groups have found exactly the opposite thing. Opposite findings would fall on either side of the vertical axis through x=1. This example again brings out the point that a rigid adherence to a 95% CI may result in a nonsensical outcome. Yet programmes to foster critical appraisal typically invite interpretations of this sort by questioning whether the interpretation of the data would be the same at the upper and lower ends of the confidence interval (Reference Oxman, Cook and GuyattOxman et al, 1994).
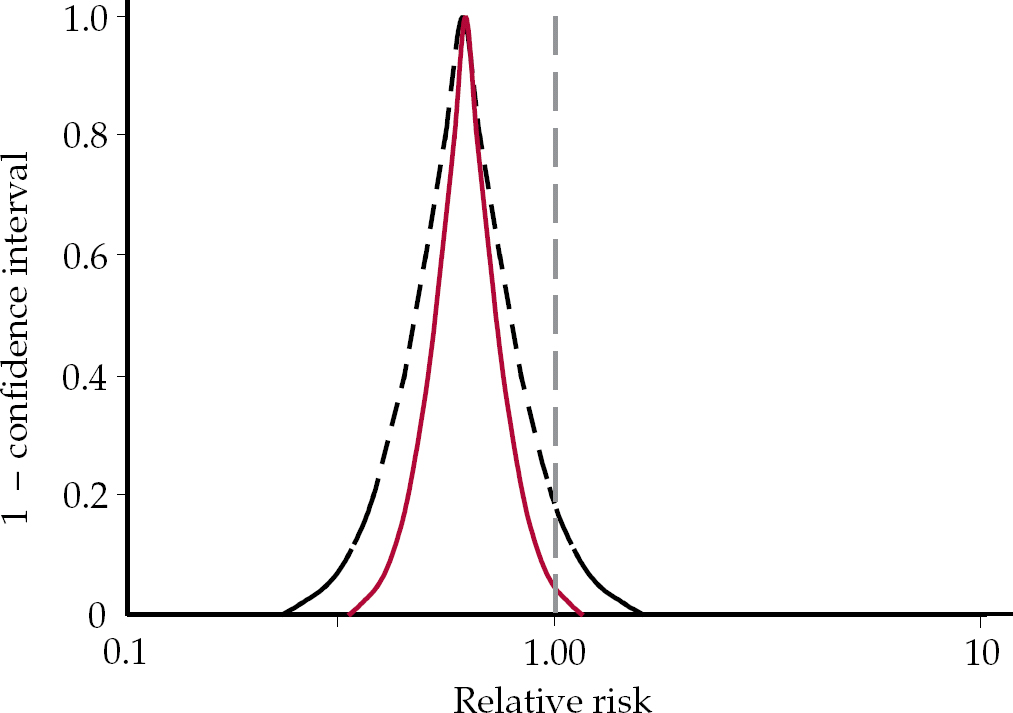
Fig. 3 P-value functions for Hommes et al (solid red curve) and Messori et al (dashed black curve) data (redrawn with permission from Reference Rothman, Lanes and RobinsRothman et al, 1993).
Using this analysis, if we return to the Reference Beasley, Dornseif and BosomworthBeasley et al(1991) paper it is clear, that although the statement ‘the analysis of the incidence of suicidal acts revealed no statistically significant differences in the act rates between fluoxetine treated and placebo treated patients’ is supportable, it should not lead to the conclusion that ‘data from these trials do not show that fluoxetine is associated with an increased risk of suicidal acts or emergence of substantial suicidal thoughts among depressed patients’.
Relative risk
Another team working on behalf of Eli Lilly analysed the data for suicidal acts in trials of fluoxetine for bulimia nervosa (Reference Wheadon, Rampey and ThompsonWheadon et al, 1992). They reported that ‘analysis of the incidence of suicidal acts did not indicate an increased risk with patients with bulimia nervosa treated with fluoxetine compared to placebo’. The relative risk in this case of 1.5 (95% CI 0.3–6.9), however, is clearly increased and with this confidence interval the data are potentially consistent with that risk being 6.9 times greater.
In a comparable vein, Reference Khan, Khan and KoltsKhan et al(2003) looked at suicide rates in clinical trials of selective serotonin reuptake inhibitors (SSRIs), comparators and placebo from a complete set of trials lodged with the US Food and Drug Administration, reporting on the outcomes for 48 277 people with depression. Although the percentage of suicides was 0.15% among those taking SSRIs, 0.20% for those on other antidepressants and 0.10% for those on placebo, they stated that there was ‘no statistical difference in suicide rate among patients assigned to SSRIs, other antidepressants or placebo’, and went on to say ‘the only possible conclusion supported by the present data is that prescription of SSRI antidepressants is not associated with a greater risk of completed suicide’. However, even a secondary school student could see from these figures that the risk on active treatment is greater than on placebo. The relative risk of a suicide on SSRIs compared with placebo is 1.4 (95% CI 0.56–3.62), and comparing all anti-depressants with placebo gives a relative risk of 1.62 (95% CI 0.66–4.02).
When the crisis regarding suicidality in paediatric SSRI trials emerged in 2003, a task force for the American College of Neuropsychopharmacology, on the basis that ‘there were no statistically significant increases in suicidal behaviour and suicidal thinking’, concluded that ‘taking SSRIs or other new generation antidepressant drugs does not increase the risk of suicidal thinking or suicide attempts’ (Reference Mann, Emslie and BaldessariniMann et al, 2005). But the task force itself presented a relative risk of a suicide-related event on SSRIs that was 1.4 times greater than that on placebo.
Evidence and signals
The first clinical reports of suicidality among patients taking antidepressants (Reference Teicher, Glod and ColeTeicher et al, 1990) were commonly referred to as signals. Since that time, any clinical trial evidence of increased risk that does not reach significance at a 95% CI has been referred to as a signal. Signals are not cause for action for most clinicians.
But in the current climate there is no simple way to know when signals become evidence. For example, when recent paediatric trials of antidepressants showed a significant increase of suicidal acts on active treatment compared with placebo at the 95% CI, this was also portrayed as a signal. One can argue that the clinical trial signal in this case only becomes significant when data from several different antidepressants are pooled, and there is therefore no ‘evidence’ that any individual antidepressant causes suicidality.
Thus, guidelines for parents prepared by the American Psychiatric Association (APA) and American Academy of Child and Adolescent Psychiatry (AACAP) can still pose the question: ‘Do anti-depressants increase the risk of suicide?’ and answer it: ‘There is no evidence that antidepressants increase the risk of suicide’ (American Psychiatric Association & American Academy of Child and Adolescent Psychiatry, 2005). Indeed, a spokesperson for the APA and AACAP could state ‘It does appear that these medications may affect the likelihood that a patient will actually tell someone about their suicidal thoughts or even suicide attempt. From my perspective as a child and adolescent psychiatrist, this is actually a good thing, because it means you have the opportunity to intervene and keep the child safe’ (Reference FasslerFassler, 2005).
Anxiety: a suicide risk?
One of the most striking instances of the unwillingness to think that signals might offer evidence of a hazard posed by a therapy came from Reference Khan, Leventhal and KhanKhan et al in a 2002 review of deaths by suicide of adults participating in clinical trials of fluoxetine, paroxetine, sertraline, clomipramine, fluvoxamine, clonazepam and venlafaxine for obsessive–compulsive disorder, post-traumatic stress disorder, social phobia, generalised anxiety disorder or panic disorder. From this dataset, they concluded: ‘We found that suicide risk among patients with anxiety disorders is higher than in the general population by a factor of 10 or more. Such a finding was unexpected… The sample of patients selected was considered at minimal risk of suicide’ (Reference Khan, Leventhal and KhanKhan et al, 2002). Anxiety disorders, they suggested, posed a risk of suicide.
In fact, this dataset on 12 914 patients taking active treatment and 3875 patients taking placebo reported 11 suicides in the active treatment groups and no suicides in the placebo groups. The data on suicidal acts were incomplete but combined data for suicidal acts and suicides show a relative risk of 1.65 for active treatment over placebo. It takes a prior judgement that antidepressants could not trigger suicide to interpret such data as evidence for the suicide risk posed by anxiety disorders rather than by the antidepressants used to treat them.
Reading the signals
Reference AnthonyAnthony (2005), of behalf of the Pharmaceutical Research and Manufacturers of America (PhRMA), states a concern some may have with equating signals with evidence:
‘FDA will send out this information which they concede is just early signal information … it sounds very good in principle. But I want you to think about it in terms of your reputation. It is really the reputation of a brand that is being signalled. Imagine yourself, someone reporting that they had early information that you may be a child molester. I know that sounds extreme but it is that type of thing… It is just an allegation, and everyone agrees that … [However,] that is what people will remember, and that is the reason there is a lot of concern about presenting early signal information when you don't really have any proof. It is very different than the kind of rigorous process we had in the past, where you had to do a trial and it had to be statistically significant before you presented that’.
What must be clear from the above is that one way to ensure that signals do not become significant is to keep trials underpowered. This highlights the fact that the decision-making tool of statistical significance is nested within another set of decisions – namely, whether to explore the significance of hazards or not. In terms of traditional interpretations of statistics on the adverse events of therapies, patients and physicians have been hostages to power. I suggest a way around this problem in the final section of this article.
In fact, although the story of SSRIs and suicide is traditionally couched in terms of anecdotal signals that originated in case reports from the 1990s, had a cumulative meta-analysis of published SSRI trials been undertaken since 1988, it would have shown a relative risk of suicidal acts on SSRIs compared with placebo of 2.93 (95% CI 0.45–18.9) (Reference Fergusson, Doucette and Cranley-GlassFergusson et al, 2005). For every year since 1988, the relative risk of suicidal acts on SSRIs has been double that of placebo, even though many of the published trials either did not report suicidal acts or reported them as having happened on placebo rather than on active treatment.
Saving lives
In December 2004, the Medicines and Healthcare products Regulatory Agency (MHRA) published a report on antidepressants and suicide (Committee on Safety of Medicines Expert Group on the Safety of Selective Serotonin Reuptake Inhibitors, 2004). This gave data for suicides in adult placebo-controlled trials of sertraline, citalopram, escitalopram, fluvoxamine, venlafaxine and mirtazapine from which the relative risk of completed suicide on active treatments compared with placebo emerged as 2.42. The relative risk for suicidal acts on active treatment was 2.37 compared with placebo and the relative risk for the combination of both suicides and suicidal acts compared with placebo was 2.38. These values of 2.37 and 2.38 are statistically significant but have not led to clear warnings. Why not?
In the wake of the FDA's decision to put a black box warning on antidepressants, the APA responded that this might have ‘a chilling effect on appropriate prescribing for patients’ and said ‘The American Psychiatric Association believes that antidepressants save lives’ (American Psychiatric Association, 2004). The British regulator, MHRA, appears to take a similar position as regards warnings – the only options being that antidepressants are available without suicide warnings (for adults) or effectively banned (for children).
Assay or efficacy: choose your word carefully
There is no direct evidence base in clinical trial data to support the position that antidepressants save lives. A possible indirect support might lie in evidence that antidepressants ‘work’. If they work it can be presumed that if patients who are depressed continue to take them this will reduce their risk of suicide.
The issue of whether antidepressants ‘work’ opens up further questions regarding the meaning of the antidepressant figures. When published trials for antidepressants are meta-analysed (e.g. Reference Kirsch and SapirsteinKirsch & Sapirstein, 1998), the results suggest that about 50% of patients on an active drug respond whereas 40% on placebo respond. Results of this sort are conventionally taken as evidence that the drugs work.
However, many, including the regulators who approve the drugs on the basis of such trials, regard antidepressant trials as assay systems aimed at demonstrating a treatment signal from which a presumption of efficacy can be drawn, rather as efficacy trials. In typical antidepressant assays, a selected set of rating scale outcomes rather than real-life outcomes is followed. If these trials are simply assay systems, it can be reasonable to discount and leave unpublished evidence from failed trials in which an active treatment fails to distinguish from placebo, on the basis that the trial lacked assay sensitivity. But the corollary of this is that we have little solid evidence that antidepressants actually work (Reference Stang, Hense and JockelStang et al, 2005).
Alternatively, if we regard antidepressant trials as efficacy trials then both those demonstrating and those not demonstrating a treatment effect should be thrown into the meta-analytic hopper, and if this is done the degree of superiority of active treatment over placebo for adults may be little more than 5%, or a mean of 2 points on Hamilton Rating Scale for Depression scores, or no greater than it was shown to be in paediatric antidepressant trials (Reference Khan, Warner and BrownKhan et al, 2000; Reference Kirsch, Moore and ScoboriaKirsch et al, 2002).
There are further problems with claims of efficacy. First, randomised controlled trials (RCTs) broadly speaking were created to check unfounded therapeutic claims rather than to provide fuel for a therapeutic bandwagon. It is for this reason that they are constructed on the basis of a null hypothesis, and a 95% significance level is set up to exclude false positives. When the null hypothesis turns out to be unfounded the result is not evidence that the drug works but rather an indication that it is not possible to say that the treatment does nothing. In an ideal world this would not be the signal for a vigorous marketing campaign but the point at which studies began to determine just which patients did best on this as opposed to other treatments.
Second, aside from the debate as to whether rating scale data should be read as indicative of treatment effect or of treatment efficacy, there is a problem in reading the difference on rating scale scores between active treatment and placebo in a ‘first past the post’, ‘winner takes all’ manner. Whether we are dealing with an effect or efficacy, trials enable us to quantify the contribution from the drug as a component of the therapeutic response where it is not readily possible to quantify the other components of that response. From the RCT data cited above, it appears that when people improve during antidepressant trials, 80–90% of the response seen can be attributed to the natural history of the disorder, or to the effect of seeking help, or to the benefit of any lifestyle advice or problem-solving offered by the clinician, or to what has been called transference or related aspects of the therapeutic encounter. These components combined are traditionally subsumed under the heading of the placebo response. They cannot readily be separated out and weighed, in the way the drug component can be, although Reference Kirsch and SapirsteinKirsch & Sapirstein (1998) have offered some evidence that the natural history of depression may account for up to 33% of the placebo response – in other words, more than the specific drug effect.
The psychiatrist's role
The ambiguities regarding just what antidepressant trials show are deeply problematic if we expect the culture and money in mental health services to follow evidence of efficacy – and to advocate otherwise would be irrational. In psychiatry, RCTs of penicillin for general paralysis of the insane would probably quantify the drug effect as a component of the therapeutic response at 90% or more, and no one would argue about money and culture following such evidence. But what should happen if the combined non-drug components contribute four times more of the eventual response to treatment in standard cases than does the active drug? If the money and culture are to follow the evidence in this scenario, where should they go?
One possibility is to modify the APA statement to say that psychiatrists rather than antidepressants can save lives. For example, we might expect lives to be saved in the case of clinical practice, informed by the evidence, that restricts antidepressant use to cases in which it is clear that the condition has not resolved of its own accord, efforts at problem-solving have not led to a resolution, and hazards such as suicide arising from the severity of the condition have shifted the risk–benefit ratio in favour of a closely monitored drug intervention with informed patients, rather than non-intervention.
Aside from the scientific and clinical merits of this position, there is a political case for reading the data this way, in that if there is no evidence that antidepressants pose risks and if antidepressants rather than physicians save lives, then in a brave new world in which healthcare is being segmented, it is not difficult to foresee a future in which depression screening and treatment might be undertaken by non-medical personnel.
Hostages to power?
We owe the idea of a 95% significance level to the mathematician and geneticist R. A. Fisher, and the notion of confidence intervals to his peer, the statistician Jerzy Neyman. Both men thought they were dealing with claims that could be made about reality. Both disagreed fundamentally. Neither envisaged an application to therapy.
Statistical methods today are seen as methods to summarise data rather than methods that speak to the nature of reality. When statistical methods were introduced into the evaluation of therapies, it was to safeguard both patients and therapists. Fisher's relatively strict standard of a 95% significance level was adopted for demonstrations of treatment efficacy to eliminate the harm stemming from false-positive claims made by quacks aiming to make money from vulnerable patients. Neyman's concern was that Fisher's methods might miscategorise true hypotheses as false and thus close down research that should continue. His primary tool to manage the risk of false negatives was the confidence interval, the aimed of which was to profile hypotheses in a way that might point toward further lines of research. Confidence intervals were an alternative to, rather than a different form of, significance testing. Lack of significance should not lead to the conclusion that nothing had been found, and it was not something to be solved simply by increasing power. In the case of the antidepressants, smaller trials but with instruments sensitive to the emergence of suicidal ideation would have helped establish the characteristics of the probably small group of patients vulnerable to such developments.
But the statistical wires seem to have got crossed when applied to therapeutics. In the case of putative antidepressant benefits, Fisher's stringent standard is relaxed so that evidence of a treatment effect in as few as one in three trials is taken as a sufficient signal of potential effectiveness to permit a drug to be marketed. In contrast, when it comes to adverse effects, unless confidence intervals exclude 1.0 the results are dismissed in a manner that is at odds with the rationale for using these intervals.
Coming to the point (estimate)
It may be that the problem stems from the bias of therapists to see a treatment's benefits and to miss its hazards. But this alone offers a good argument for divorcing data on the relative benefits and risks of treatments from automatic significance testing. After all, the point estimate drawn from available evidence offers the most probable value for a risk. If significance testing were taken out of the frame, then an increased point estimate for risk would ordinarily indicate an increased risk rather than evidence of no risk. Adopting this approach does not require any philosophical or methodological justification in that an increased point estimate offers a commonsense basis to lay bets on the outcome. The burden of persuading us that white is really black would face drug companies rather than physicians or patients.
Furthermore, presenting a point estimate for the benefits of treatment drawn from all trials of an agent rather than demonstrations of a treatment effect in selected trials would, in the case of antidepressants, make it clear that these agents are not the equivalent of penicillin for depression.
Declaration of interest
D.H. has been a speaker for, consultant for or participated in clinical trials for most major pharmaceutical companies. He has also been an expert witness in legal cases involving suicide or violence in the course of antidepressant treatment.
EMIs
In each themed EMI, match the numbered statements (1, 2, 3,…) with a suitable response from the lettered options (a, b, c,…). Each option may be used once, more than once, or not at all and more than one option may be suitable for each statement.
Theme: Relative risk
An analysis of the incidence of suicidal acts by patients with bulimia nervosa treated with fluoxetine compared with placebo shows a relative risk for fluoxetine compared with placebo of 1.5 (95% CI 0.3–6.9).
-
1 You should warn your eating disorder patient that there is a small risk of clinical worsening and possible suicide, even though:
-
2 If your eating disorder patient takes their own life after starting fluoxetine, on balance the data point to a probable role for the treatment even though:
-
3 At an inquest on your patient, the company would argue that there is no risk from their treatment because:
Options
-
a NICE has advocated the use of fluoxetine in eating disorders with no mention of a risk of suicide.
-
b the MHRA has not warned of a risk of suicide with fluoxetine for any indication.
-
c warning about a risk of suicide would cast an unwarranted slur on a pharmaceutical company, perhaps even leaving one open to a libel action.
-
d the data are consistent with a 70% reduction in risk of suicidal acts.
-
e the risk is a relative risk rather than an absolute risk.
-
f as the data do not reach statistical significance, some would say there is an absence of evidence to indicate a risk.
-
g the data on increased risk are consistent with data from other clinical groups showing an increased risk.
Theme: Outcome measures
When balancing the benefits of treatment with fluoxetine against the risk of suicide from depression trials in which the risk of a suicidal act is 1.9 times greater on fluoxetine than on placebo (95% CI 0.2–16.0):
-
4 Real-life outcome measures of benefit to set against the real-life hazard outcomes of a suicidal act can be found by consulting:
-
5 You are likely to be told by some advocates of evidence-based medicine that you should pay no heed to data such as ___ because that has not been powered sufficiently to give a reliable index of what is happening.
-
6 The following are termed surrogate outcome measures:
Options
-
a fluoxetine clinical trial Hamilton Rating Scale for Depression (HRSD) scores.
-
b fluoxetine clinical trial Clinical Global Impression scores.
-
c fluoxetine clinical trial data from the Suicide item (item 3) on the HRSD.
-
d meta-analytic data from fluoxetine trials showing numbers of lives saved from suicide compared with placebo.
-
e visible signs of worsening clinical condition (a sample of n = 1).
-
f what you are told by your local pharmaceutical company representative.
Theme: Interpretation of results
You are a researcher given access to data on 15 000 patients, 11 000 exposed to active treatment and 4000 to placebo, and you have 11 suicides on active agent and none on placebo for a condition not usually linked to suicide.
-
7 When consulted by the MHRA, NICE or a company making one of these compounds on how to investigate this hazard further, you:
-
8 If hide the problem, while at the same time trying to appear scientific, you might:
-
9 When asked by the media whether this is a real issue, you:
Options
-
a suggest a new trial with a few hundred participants using a rating scale sensitive to the emergence of suicidal ideation.
-
b suggest a new trial with a few hundred participants using a rating scale for treatment-emergent agitation.
-
c suggest re-analysing the data to look for rates of drop out owing to agitation.
-
d suggest a new trial in 50 000 patients.
-
e suggest looking at national suicide rates since the introduction of these drugs.
-
f conclude that the key thing now is to establish which patients are at risk from active treatment.
-
g conclude that the problem is rare – it only occurs at a rate of 1 per 1000 treated patients, and psychiatric conditions are linked to a risk of suicide.
-
h conclude that the problem is real and despite the absolute risk being low, given the millions likely to take the treatment the final tally may approach the dimensions of a public health disaster.
Theme: Confidence intervals
Confidence intervals are consistent with all possible values. You, however, are faced with an analysis of the incidence of suicidal acts in patients with bulimia nervosa treated with fluoxetine compared with placebo that shows a relative risk of suicidal acts on fluoxetine of 1.5 compared with placebo with a 95% CI of 0.3–6.9.
-
10 This interval offers:
-
11 This interval does not offer:
-
12 Where the interval ranges broadly and includes 1.0, it suggests:
-
13 The following suggestion is designed to block rather than assist your understanding of the issues:
Options
-
a an arbitrary dichotomisation of the data.
-
b upper and lower limit values that are equally likely.
-
c the range within which the true value lies.
-
d a modern method to test for statistical significance.
-
e the experiment was not sufficiently powered to achieve a result.
-
f the experiment was not sufficiently discriminating to achieve a result.
EMI correct matchings

| 1 | 2 | 3 |
| a, b, d, e, f | d, e, f | a, b, f |
| 4 | 5 | 6 |
| none | e | a, b, c |
| 7 | 8 | 9 |
| a, b, c, f | d, e | h |
| 10 | 11 | 12 |
| a, b | c, d | f |
| 13 | ||
| e |


eLetters
No eLetters have been published for this article.