

Neuroimaging techniques enable the visualisation of the anatomy, function and pharmacology of the brain. Some techniques, such as computed tomography (CT), electroencephalography (EEG) and structural magnetic resonance imaging (sMRI), are well established in clinical practice, whereas more contemporary techniques, such as functional MRI (fMRI) and diffusion tensor imaging (DTI), have yet to show their full translational potential. This article offers an introduction and overview of the main neuroimaging techniques and their application to mental disorders. It is not meant as a comprehensive guide, but rather an introduction to the potential and excitement of these approaches. Three main sections are presented: first, an introduction to the most commonly used neuroimaging techniques; second, a review of their application to psychiatric research; and third, an overview of contemporary research trends in the field. Box 1 gives a little background to some of the techniques discussed.
BOX 1 A bit of history
Structural MRI
The first MRI machine was patented in 1972 by Raymond Damadian with the purpose of scanning individuals to locate cancerous tissue. A year later, Paul Lauterbur developed a method for generating 2D and 3D images which allowed him to publish the first image of a rat scan. Peter Mansfield applied a mathematical model that enabled improvement of the images and significantly reduced scanning time. The first human was scanned in 1977. In 2003, Lauterbur and Mansfield received the Nobel Prize in Physiology or Medicine for their work concerning MRI.
Functional MRI
The first attempt to measure blood flow in the brain as an index of cognitive activity traces back to the late 19th century and an Italian neuroscientist named Angelo Mosso. More recently, several innovations across the world contributed to the development of fMRI, but the technique is usually attributed to the work of Ogawa and Kwong in the early 1990s, who were the first to demonstrate that fMRI signals actually reflected the BOLD changes linked to neuronal activity.
Positron emission tomography
During the 1950s, several lines of research contributed to the development of PET, including the first demonstration of annihilation radiation as a tool for medical imaging. In 1961, James Robertson and colleagues developed the first PET scan, but the tool could not be used medically until suitable radiopharmaceuticals became available. The first human PET imaging using compounds occurred in 1976.
Electroencephalography
EEG is the oldest of neuroimaging techniques, tracing back to studies conducted in 1870s which demonstrated the presence of electrical activity in exposed animal brains. In 1924, Hans Berger created the first prototype EEG device, which he used to record the first human EEG. The clinical use of EEG is also quite old, as the first studies showing the electrical pattern of seizures began in 1935.
Magnetoencephalography
In the late 1960s, David Cohen was the first to measure MEG signals, using a standard coil detector placed inside a magnetically shielded room. However, the signal from these first attempts was quite noisy. Things improved when James Zimmerman, an engineer working for Ford, developed a very sensitive shielded system of magnetometers able to detect subtle magnetic fields (a superconducting quantum inference device or SQUID). SQUID detectors, which are now used by all MEG devices, allowed a signal to be produced that is as good as that in EEG.
What can psychiatry use?
Structural magnetic resonance imaging
Structural MRI (sMRI) exploits the physical properties of atoms in the body to create high-quality 3D images of the various tissues so that their appearance and morphology can be examined. Visualisation is made possible because each type of tissue (e.g. bone, grey matter, white matter, cerebrospinal fluid) reacts differently to magnetic and radio wave frequencies. Although this technique is based on electromagnetic radiation, it does not involve exposure to ions or X-rays, which makes it relatively safe and allows for multiple exposures (Reference Goldstein, Price, Dougherty, Rauch and RosenbaumGoldstein 2004). SMRI uses a scanner containing a powerful static magnet. The strength of the magnet is measured in tesla (T) and it directly affects the potential definition and image quality. At present, most magnets in clinical use are 1.5 T or 3 T, but there are a few 7 T magnets in specialist centres. Interestingly, although the human body is made of multiple elements, it is the hydrogen in it that is exploited by MRI to generate the image. This is possible as hydrogen has high levels of both density and magnetic susceptibility (Reference Goldstein, Price, Dougherty, Rauch and RosenbaumGoldstein 2004).
Making the choice: sMRI or CT?
Unlike other neuroimaging techniques, sMRI is widely used in both research and clinical settings, particularly for the investigation of the brain’s physical properties, such as cortical thickness, tissue volume and the size and shape of structures and lesions. Therefore, most clinical applications include the detection of brain abnormalities, staging of the disease, monitoring of treatment progress and planning of surgical treatment. However, some of these can also be performed using CT: the choice of one technique over the other depends on clinical as well as practical matters. For example, CT is superior in detecting bones and calcified lesions, whereas sMRI provides better soft tissue detail, making it the preferred tool for the investigation of the central nervous system (Reference Park, Gonzales, Dougherty, Rauch and RosenbaumPark 2004). As CT is quicker and relatively cheaper, it is far more commonly used in acute settings where medical stability still needs to be ascertained. Both tools present some disadvantages. For example, MRI is not suitable for obese people (because of the dimensions of the scanner) or for those with severe claustrophobia or agitation, body metal or prostheses, whereas CT is not recommended for pregnant women or very young children, as it involves exposure to ionised radiation.
In research, sMRI is often used to:
-
develop imaging-based diagnostic and staging criteria
-
clarify the differences between normal and abnormal structures, and between different diagnoses
-
test algorithms for automatic diagnosis and staging
-
explore the effects of medication on brain structures
-
connect psychiatric and biochemical abnormalities to changes in structure for a better understanding of pathophysiology.
Functional magnetic resonance imaging
Functional MRI (fMRI) employs the same magnet device, differences in tissue properties and physics used in sMRI to derive brain images (Fig. 1). However, the goal of fMRI is to visualise brain activity and so spatial resolution is sacrificed to the benefit of temporal resolution. To get an idea of the difference in image quality between the two techniques it should suffice to say that to acquire a scan of the entire brain takes in the order of 6 minutes for sMRI and 3 seconds for fMRI. Crucially, fMRI is not at sufficient temporal resolution to directly measure the neuronal signal and so it measures an indirect index of neuronal activity – the blood oxygen-level dependent (BOLD) contrast.

FIG 1 A high-quality fMRI scan from a 3 T scanner. Image courtesy of Dr O. O’Neil (own work); CC-BY-SA-3.0, via Wikimedia Commons.
BOLD
The principle behind BOLD is that an active population of neurons will receive more fresh, oxygen-rich blood flow than non-active neurons (Reference AshbyAshby 2011). It is this variation between the magnetic signal of oxygenated and deoxygenated blood in the brain that constitutes the basis for the fMRI signal. The big challenge with fMRI is that the signal change due to the difference in oxygenation is modest; for example, an increase of about 4% of the baseline signal is present in the visual cortex during processing of visual stimuli (using 1.5 T scanner) and about 0.25% during more subtle cognitive processes, such as memory or language comprehension.
Mapping function/process to brain activity
Most fMRI studies are concerned with mapping the function (or cognitive process) to the activity in a related brain structure or network of structures and so will attempt to elicit and manipulate a specific process through the use of well-designed experimental tasks. Hence, fMRI requires multiple repetitions of the experimental task and complex statistical analyses to extract the subtle stimulus-related signal from background noise.
Research and clinical use of fMRI
Functional MRI is extensively used in research to:
-
identify brain networks underlying specific psychological functions
-
test cognitive models of illnesses
-
examine the functional connectivity across different regions of the brain.
Clinical use of fMRI is primarily confined to presurgical functional mapping with the aim of improving functional localisation and risk assessment (Reference PillaiPillai 2010).
However, research highlighted the possibility of widening fMRI’s clinical potential to include the mapping of spontaneous neural activity underlying clinical episodes such as epileptic seizures, the identification of target areas for functional surgery such as deep brain stimulation, the assessment of drug efficacy, and the evaluation of brain plasticity for neurorehabilitative treatments (Reference Matthews, Honey and BullmoreMatthews 2006).
Positron emission tomography and single-photon emission computed tomography
Positron emission tomography (PET) and single-photon emission computed tomography (SPECT) are used to investigate functional brain activity at the metabolic level. These techniques are based on the idea that it is possible to learn about a dynamic process by introducing a measurable tracer into a target system and then tracking this as it travels around the system. Indeed, both PET and SPECT involve the administration of a radiopharmaceutical tracer which, once absorbed, emits gamma rays that can be detected by the scanner and thus provide an image of the distribution of the tracer in the body over time (Reference Russell, Zelaya, Bressan, Fu, Senior and RussellRussell 2003). There are numerous criteria that the radiopharmaceutical needs to fulfil. It must not perturb the target system, but it must interact with the system in a predictable way, provide a quantifiable measure of concentration, show both high affinity and selectivity for the target, be safe for intravenous injection, be non-physiologically active at low doses and efficiently cross the blood–brain barrier. It is clear that the development of tracers for human use is not a quick or easy task.
Applications of PET and SPECT
A key difference between PET and SPECT is that PET can measure glucose metabolism and blood flow as indices of neuronal activity, whereas SPECT can only measure the latter (Reference Dougherty, Rauch, Fischman, Dougherty, Rauch and RosenbaumDougherty 2004). Both tools can be used to measure various aspects of receptor binding and neurotransmitter function and have proven to be clinically valid for the detection of functional alterations linked to various dementia types. Thus, they could both play a key role in diagnosing neurodegenerative dementias, reducing the rate of false positives (Reference SilvermanSilverman 2004).
As both PET and SPECT measure blood flow, they can also be useful for the early diagnosis and assessment of cerebrovascular diseases (Reference Dougherty, Rauch, Fischman, Dougherty, Rauch and RosenbaumDougherty 2004). Early diagnosis would be possible because cortical and subcortical dysfunctions detected by PET/SPECT appear to occur well before extensive behavioural or motor abnormalities, or the structural abnormalities detected by techniques such as CT and MRI. In epilepsy, PET and SPECT are particularly useful for confirming the diagnosis in the absence of EEG abnormalities, as they can detect metabolic abnormalities and patterns that are characteristic of the disorder. PET and SPECT are also used for the imaging of neoplasms and head traumas (Reference Dougherty, Rauch, Fischman, Dougherty, Rauch and RosenbaumDougherty 2004).
In research, these tools can be used to acquire information about neuroreceptor binding, which makes them particularly fruitful in drug development (Reference Matthews, Rabiner and PasschierMatthews 2012).
It is important to highlight that the development and applications of these tools are constantly evolving as new technology and radiotracers are introduced. At present, both techniques have advantages and disadvantages. For example, PET has better resolution and can monitor both glucose and blood flow, whereas SPECT generally uses more long-lasting tracers, allowing the study of more durable functions.
Electroencephalography and magnetoencephalography
Electroencephalography (EEG) and magnetoencephalography (MEG) provide the most direct non-invasive measure of brain activity. Both tools detect activity associated with postsynaptic potentials, but EEG records the electrical fields of neurons, whereas MEG records their magnetic fields. In both techniques, the measurement comes from the scalp surface, via electrodes attached to a cap for EEG or via a complex system of magnetometers in a helmet for MEG (Fig. 2). As the signal generated by a single neuron is too weak to be detected at the scalp level, EEG and MEG can only pick up the waves coming from multiple neurons aligned in the same direction and with a synchronous flow. Thus, it is assumed that the main source of the signal comes from pyramidal cells along the cortex, as these are the ones best fitting these criteria (Reference Lopes da Silva, Mulert and LemieuxLopes da Silva 2010).
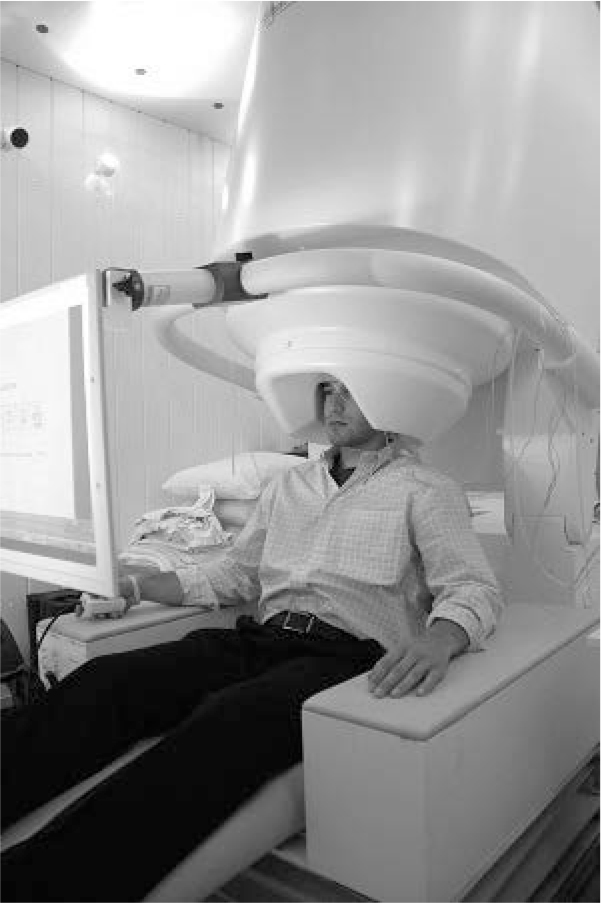
FIG 2 Magnetoencephalography (MEG) scanner with a person doing a task. Image courtesy of the National Institute on Aging/National Institutes of Health.
The main benefit of EEG and MEG is the great temporal resolution that they provide, recording at a very high sampling rate (up to 10 000–20 000 Hz or data points per second). However, the spatial resolution is quite limited, especially in EEG, where the thickness of the skull can easily smear the regional cortical signal and spread it across a broad area. This introduces a level of uncertainty into the estimation of the spatial sources of the signal. On the positive side, these procedures are better tolerated, less invasive, confer less risk and have fewer contraindications. MEG has a slightly better spatial resolution, but EEG can detect signals from deeper parts of the brain (Reference Goldenholtz, Ahlfors and HamalainenGoldenholtz 2009). Consequently, neither is always preferable over the other and some evidence suggests that a combined use gives the best results (Reference Goldenholtz, Ahlfors and HamalainenGoldenholtz 2009). However, as MEG is more expensive and requires sophisticated shielding, it is usually found in only a few specialist centres, whereas EEG is far more commonly used in clinical settings.
One of the most common clinical uses of EEG is in the diagnosis and treatment of epilepsy, as a way of measuring excessive or abnormal brain activity underlying the disorder. For example, it is routinely used to confirm the diagnosis of epilepsy emerging from clinical assessments and records. EEG can be indispensable in classifying seizure type and thus diagnosis, as sometimes these are based entirely on the electrical profile of the seizures (Reference Alarcon, Alarcon and ValentinAlarcon 2012). Also, EEG is often used to decide whether patients need surgery, for example by localising seizure foci, and to monitor the condition, for example by establishing the effects of anti-epileptic medication on seizure frequency (Reference Alarcon, Alarcon and ValentinAlarcon 2012).
In research, both tools are used to explore the neural pathophysiology underlying various mental disorders by providing detailed information about the temporal characteristics of relevant neural processes.
Summary
Table 1 contains useful information for comparing most popular neuroimaging techniques on a number of key features.
TABLE 1 The most popular neuroimaging techniques at a glance

Other techniques
The techniques mentioned here are not the full story: more are available and some of these are outlined in Box 2.
BOX 2 There is more: other neuroimaging techniques
Computed tomography employs the differential ability of various body structures to absorb X-rays to create 3D images of target areas. This technique is particularly good at distinguishing between bones, blood vessels and organs, and so can well detect bone traumas, tumours and haemorrhage.
Diffusion tensor imaging allows imaging of the organisation and orientation of brain white matter fibres by using the information derived from the movement of water molecules inside the tissues. DTI is an invaluable tool as it is at present the only method by which we can visualise white matter anatomy, which is still largely unknown.
Ultrasound imaging involves sending high-frequency sound waves to a target region and registering their returning echoes. The transformation of sound waves into sensible images is possible because different body structures return waves at different intervals. Crucially, images can be captured in real time and so movement of blood flow, organs or fetus can be captured as well. In mental health, ultrasound is primarily used for the detection and monitoring of prenatal abnormalities.
Magnetic resonance spectroscopy enables us to obtain information about the biochemistry of tissues, which can be compared to identify tissue change following strokes or tumours. The benefit of this tool is that it enables detection of differences that may well precede structural changes detectable with MRI. Magnetic resonance spectroscopy is mainly used in research, but it can be clinically helpful in distinguishing between different types of lesion or metabolic brain disorder.
Near-infrared spectroscopy uses near-infrared light to measure haemodynamic response to neuronal activation. This technique employs sensors able to detect the differential reflection of light transmitted to the cortex through the skull. Light reflection differences depend on blood oxygen level, which in turn is dependent on neuronal activity. The tool is primarily used with infants as, unlike MRI, it does not require babies to stay still.
Arterial spin labelling is a non-invasive technique that uses magnetically labelled water in the blood as an endogenous tracer to acquire a measure of perfusion, namely the delivery of nutrients to tissues via blood flow. In mental health research, this technique is very useful if coupled with fMRI, as it allows disentangling of changes in blood flow linked to experimental manipulation from those linked to perfusion abnormalities.
Applying neuroimaging to mental disorders
This section will showcase a few of the more interesting examples of the application of neuroimaging to psychiatric research. In particular, we aim to demonstrate how neuroimaging has been used to improve our conceptualisation of mental illness, examine cognitive models of illness, investigate the biological mechanisms of action underlying pathology, develop therapeutic approaches, and identify diagnostic and prognostic biomarkers.
Schizophrenia
One benefit of using neuroimaging in psychiatric research is its role in testing cognitive models of illness, especially using fMRI, which allows study of the brain while engaged in cognitive tasks. This is especially important for conditions such as schizophrenia, whose underlying pathophysiology is still unknown. For instance, a series of fMRI studies has helped to elucidate the formation of hallucinations in schizophrenia, demonstrating that both speech generation areas and speech perception areas are active during auditory hallucinations (Reference Shergill, Brammer and WilliamsShergill 2000) and that mechanistic treatments such as transcranial direct current stimulation (tDCS) or repetitive transcranial magnetic stimulation (rTMS) can be used to modulate brain activity in these regions and improve symptoms (Reference Moseley, Fernyhough and EllisonMoseley 2013). This supports a broader model that hallucinations reflect a misattribution of self-generated actions to others due to incapacity to differentiate between sensory signals deriving from external sources and those deriving from internal actions such as inner speech or thoughts (Reference Fletcher and FrithFletcher 2009). In support of this, research has found reduced BOLD activation in the somatosensory cortex of healthy controls when performing a self-generated (as opposed to externally generated) movement; however, people with schizophrenia lacked this attenuating mechanism and showed increased cortical activation in response to these self-generated movements (Reference Shergill, White and JoyceShergill 2014). Crucially, this activation was correlated with hallucination severity, thus corroborating the link between dysfunctions in self-monitoring and hallucinatory symptoms.
Applications of fMRI have also provided interesting insights into the psychological mechanisms underlying paranoid delusions, pointing towards lack of trust and reduced reward from social interactions as potential key elements. Using trust games, Reference Gromann, Heslenfeld and FettGromann and colleagues (2013) found that patients displayed reduced baseline trust of others. In addition, when playing with cooperative people, patients showed reduced caudate activity, which was inversely correlated with paranoia measures. Considering the established role of the caudate in reward-processing, and in positive trust especially, this has been interpreted as indicating a lack of perception of positive social interactions as rewarding. Last, important advances in schizophrenia diagnosis have been possible thanks to sMRI studies showing that specific patterns of abnormal grey matter can predict the illness with good levels of accuracy (e.g. Reference Nieuwenhuis, van Haren and Hulshoff PolNieuwenhuis 2012).
Depression
In the past 30 years, neuroimaging has been a major force driving our increased understanding of the neural pathophysiology of depression, identifying target structures for potential intervention. Neuroimaging data have identified the subcallosal cingulate gyrus (SCG) as a candidate structure for deep brain stimulation (DBS), which involves delivering electrical pulses via electrodes implanted in the brain. Furthermore, PET imaging has shown increased aberrant activity in the SCG of depressed people and of healthy individuals retrieving sad autobiographical memories. Also, a decrease in SCG activity has been observed after successful treatments employing various modalities (for a review see Reference Hamani, Mayberg and StoneHamani 2011). Thanks to such research, Mayberg and colleagues could successfully target the SCG of people with depression and show symptom remission and in 35% and amelioration in 60% of the sample (Reference Lozano, Mayberg and GiacobbeLozano 2008).
Importantly, imaging techniques such as PET and EEG can also be used to acquire further information about metabolic and electrical brain activity pre- and post-surgery. In their studies, Mayberg and colleagues found that DBS caused changes in the activity of cortical and limbic structures receiving SCG projections, providing insight into the specific region or network of structures modulating the beneficial effects of DBS (Reference Hamani, Mayberg and StoneHamani 2011).
Disordered gambling
Neuroimaging studies have influenced the categorisation of disordered gambling, recently moved from the category of impulse disorders to that of addiction in the latest version of the Diagnostic and Statistical Manual of Mental Disorders, DSM-5 (American Psychiatric Association 2013). This reclassification rests on various evidence of shared features between drug addiction and gambling disorder (Reference PotenzaPotenza 2006), including similar involvement of dopamine-mediated reward circuits, as demonstrated by neuroimaging.
Links with drug addiction research
Interestingly, studies on disordered gambling are now providing implications for drug addiction research as well. A critical issue in the addictions literature is being able to disentangle brain alterations indicating illness vulnerability from those reflecting drug toxicity. It has been suggested that research on disordered gambling can provide a window onto this, as one would expect to find the former without the confounding of the latter (Reference Clark and Limbrick-OldfieldClark 2013). Recent PET studies on gambling disorder have not found the reduced striatal dopamine D2 receptor availability earlier shown to characterise drug addictions (Reference Volkow, Wang and FowlerVolkow 1997), suggesting that this finding in drug addiction might be the consequence of exogenous drugs rather than a vulnerability factor (Reference Clark and Limbrick-OldfieldClark 2013). Furthermore, fMRI studies have provided insight into which cognitive dysfunctions might be responsible for the alteration of reward mechanisms in the absence of a toxic substance. In gambling, an interesting phenomenon is that of so-called ‘near misses’, namely unsuccessful outcomes close to the jackpot. These have shown to increase the desire to gamble while recruiting the same regions (striatum and insula) activated during winning outcomes (Reference Clark, Lawrence and Astley-JonesClark 2009). This and other imaging studies suggest that cognitive distortions can be associated with some of the aberrant engagement of brain reward circuits in the absence of the neural effects of drugs.
Antisocial personality disorder and psychopathy
Antisocial personality disorder and psychopathy were largely viewed as mainly social constructs until neuroimaging data demonstrated biological differences in antisocial and psychopathic personalities (Reference Glenn and RaineGlenn 2014). Several neuroimaging studies have repeatedly shown functional and structural reductions in the brains of people with antisocial personality disorder or psychopathy which very well fit with their clinical profile. In particular, reduced volume and activity in the prefrontal cortex (PFC) (Reference Yang and RaineYang 2009) has been suggested to be associated with defects in social and moral judgements, emotional regulation and self-regulatory processes (for a review see Reference KoeningsKoenings 2012), while functional reductions in the amygdala (Reference Glenn, Raine and SchugGlenn 2009) might be linked to inappropriate emotion processing and fear conditioning (Reference Sehlmeyer, Schöning and ZwitserloodSehlmeyer 2009). Interestingly, some longitudinal neuroimaging studies have investigated whether key brain alterations could predict future antisocial behaviour. MRI is the ideal tool for this kind of study, as it is safe for repeated exposure. These preliminary studies conducted in prisoners and high-risk individuals showed reduced PFC activity and amygdala volume to be associated with offending behaviour 3 years later (reviewed in Reference Glenn and RaineGlenn 2014), suggesting that brain alterations may be causally involved in antisocial behaviour.
Neuroimaging has also been used to identify potential biomarkers for violence. Reference Raine, Lee and YangRaine and colleagues (2010) found that among people at risk of developing antisocial disorders (owing to their low socioeconomic status), those with a marker of disrupted limbic neurodevelopment, namely the presence of cavum septum pellicidum (CSP) as evidenced by sMRI, also showed increased violent and criminal behaviour. In line with evidence that CSP is associated with aggressive behaviour in animals, this suggests that predisposition to antisocial behaviour might be linked to early maldevelopment of limbic structures while also highlighting a potential role for CSP as a diagnostic marker.
The cutting edge of neuroimaging
This final section gives a brief overview of some recent trends in neuroimaging, focusing on a few promising contributions that new applications (imaging genetics), study designs (resting-state fMRI) and analyses (machine learning) are offering to psychiatry.
Imaging genetics
There has been an explosion in the volume of genetic data available for understanding the links between genes, environment and mental disorder. Given that the impact of any genetic effect is likely to be via changes in the brain, there has been a drive to investigate the influence of genes on the structural and functional brain alterations underlying a given mental illness. One of the advantages of combining genetic and neural information is that genetics is more strongly related to the neural system underlying a given behaviour than to the behaviour itself (Reference Meyer-Lindenberg and TostMeyer-Lindenberg 2012). Thus, it is thought that imaging genetics will allow the detection of subtle differences that may not emerge with behavioural genetics. Much of this work is attempting to improve illness prediction and clinically useful disease stratification – identifying imaging and genetic biomarkers that can allow clinicians to target individuals at increased risk of developing the illness or that can be used to stratify patients into those who will benefit from one treatment rather than another.
For example, research has enabled us to link the increased risk of developing Alzheimer’s disease associated with e4 allele of the apolipoprotein E (APOE) gene to reductions in grey matter volume (Reference Shaw, Lerch and PruessnerShaw 2007) and functional connectivity (Reference Filippini, MacIntosh and HoughFilippini 2009) in young people, suggesting that brain imaging on people with this mutation might help early detection of brain abnormalities.
Another area of research is concerned with assessing the degree of heritability of a given brain structure or function known to be implicated in the pathophysiology of an illness. This is usually done by correlating brain similarity in individuals to various levels of relatedness. For example, if a given structural or functional characteristic is highly similar in monozygotic twins, less similar in dizygotic twins and even less so in siblings, then the genetic heritability of that characteristic is thought to be high. This method can be used to create a heritability map of brain areas activated during a given process, so as to show which areas are more dependent on genes than others.
Other studies are more interested in identifying which genetic variations contribute to key brain alterations. For example, Reference Hariri, Mattay and TessitoreHariri and colleagues (2002) linked specific allele variations in the promoter of the serotonin transporter gene to increased amygdala reactivity in response to anxiety-provoking stimuli, thus suggesting that genetic polymorphism might drive differences in anxiety and neuroticism traits. Once the link between genetic variation and brain activity has been established for a particular illness, one can use this information to identify those at risk of developing the illness and to inform the development of better treatments.
Resting-state fMRI
Until recently, most fMRI studies have focused on linking a given trait or behaviour to activation within a specific brain area, following a fairly traditional neurological lesion model. However, there is an increasing awareness that cognitive processes are largely supported by brain networks that operate across different brain regions. In line with this, resting-state study designs are particularly useful for acquiring information about the functional connectivity between brain regions.
Resting-state fMRI studies differ in a fundamental manner from routine fMRI studies in that the neuroimaging data are acquired while the person is at rest, i.e. not performing any explicit task. The main assumption behind this technique is that in functionally related brain regions, synchronised increases and decreases in blood flow signal neuronal activity. Thus, functional connectivity can best be estimated by measuring the correlation of low-frequency fluctuations between all the different brain regions, identifying several core networks that are correlated while at rest. Crucially, it has been shown that the same networks that are active in the resting-state mode are also active during specific tasks, thus giving insight into the cognitive functions underlying the identified networks. For instance, resting-state studies identified the so-called ‘default mode network’ as an area that is largely activated at rest, but strongly deactivated during goal-oriented activities. This enabled researchers to hypothesise and confirm its role in mind-wandering, spontaneous thinking and creativity (Reference Buckner, Andrews-Hanna and SchacterBuckner 2008).
In addition to their use in the study of functional connectivity, resting-state studies are also useful whenever active participation in a task is difficult (e.g. when testing children or sedated patients) or when failure to match performances between groups would significantly affect interpretation of data.
Machine learning
Computational approaches using machine learning have been applied for many years to problems in classification. However, only relatively recently have they been used in the classification of neuroimaging data to answer new questions not addressable using standard statistical approaches. Machine learning refers to the use of algorithms capable of automatically learning the statistical regularities in empirical data and using that learning to make predictions or decisions. In neuroimaging, this means using a subset of available sMRI or fMRI data to train an algorithm to learn data properties, typically in order to differentiate two groups of individuals, so that this algorithm can be applied to novel, unselected data.
Machine learning has two main advantages over standard approaches. First, it allows predictions to be made at the individual level. This is extremely clinically relevant, as the psychiatrist’s ultimate goal is to make a diagnosis, prognosis or treatment decision from the brain imaging data of the patient in question. Second, machine learning allows use of a wider range of data, including spatial correlation data, to examine the interactions between networks.
Most applications of machine learning in clinical research have aimed at identifying brain bio markers for the improvement of diagnosis and treatment response prediction. One of the most successful applications has been in Alzheimer’s disease: machine learning can diagnose the disease from sMRI scans with 90% accuracy (Reference Kloppel, Stonnington and ChuKloppel 2008a) and distinguish it from other forms of dementia more accurately than radiologists can (Reference Kloppel, Stonnington and BarnesKloppel 2008b). This is an invaluable contribution to psychiatry, as only about 75% of diagnoses of Alzheimer’s disease made by clinicians are confirmed by post-mortem studies.
Another disorder that has been difficult to diagnose is autism, as the optimal diagnostic tool is time-consuming and requires the gathering of retrospective information. Studies show that machine learning applied to MRI data on cortical thickness can predict autism with 90% accuracy (Reference Ecker, Marquand and Mourão-MirandaEcker 2010). Important achievements have also been made in major depressive disorder, where MRI at baseline is now able to predict treatment response over time (Reference Costafreda, Chu and AshburnerCostafreda 2009).
Conclusions
In recent years, neuroimaging applications have driven many advances in mental health research. We now have a much stronger understanding of the neural basis of most psychiatric illnesses, but each increase in our knowledge opens up new and challenging questions. Currently, most imaging techniques have some sort of clinical application, but this is usually restricted to a limited number of practices and conditions. Emerging and promising applications are now focusing on some important priorities, including the identification of diagnostic and prognostic biomarkers, which could lead to more accurate diagnoses and prediction of treatment response respectively. Other priorities involve the development of efficacious treatments and the identification of neural biomarkers which can identify people at risk of developing a particular illness.
MCQ
Select the single best option for each question stem
-
1 Which of the following is true?
-
a the BOLD signal is a direct measure of neuronal activity
-
b MEG and EEG are the most direct non-invasive measures of neuronal activity
-
c PET is never used to measure blood flow
-
d fMRI does not measure hydrogen molecules in the blood flow
-
e EEG and MEG can measure activity from each neuron.
-
-
2 Which of the following is false?
-
a fMRI can be used to identify structures involved in cognition
-
b fMRI is the ideal neuroimaging tool to test cognitive models
-
c no imaging tool is always preferable over others
-
d MRI is a good candidate for longitudinal studies as it is relatively safe
-
e most imaging tools are used in either research or clinical practice but not both.
-
-
3 As regards the role of neuroimaging in antisocial personality disorder so far:
-
a it enabled the identification of biomarkers, which are now undisputedly used in clinical practice
-
b it enabled prediction of who is going to commit criminal offence
-
c the imaging evidence is so strong that criminal punishments are now based solely on neuroimaging data
-
d it contributed to reconceptualisation of the disorder as also having a biologic basis
-
e it led to the understanding that its aetiology is exclusively biological.
-
-
4 It is important to investigate brain networks:
-
a because they are particularly good for investigating genetic influences on behavior
-
b because it gives us insight into the causal relationship between neural alteration and behavior
-
c because resting-state study designs are better
-
d because cognitive processes never recruit one structure only
-
e because it is easier to investigate networks than single structures in difficult patients.
-
-
5 Sensible predictions from data of a single patient can be made using:
-
a machine learning analyses
-
b longitudinal studies
-
c resting-state designs
-
d studies combining imaging and genetic data
-
e studies employing suitable radio-pharmaceuticals
-
MCQ answers
| 1 | b | 2 | e | 3 | d | 4 | d | 5 | a |


eLetters
No eLetters have been published for this article.